Graphics Viewer Show them where they stand,
graphically...
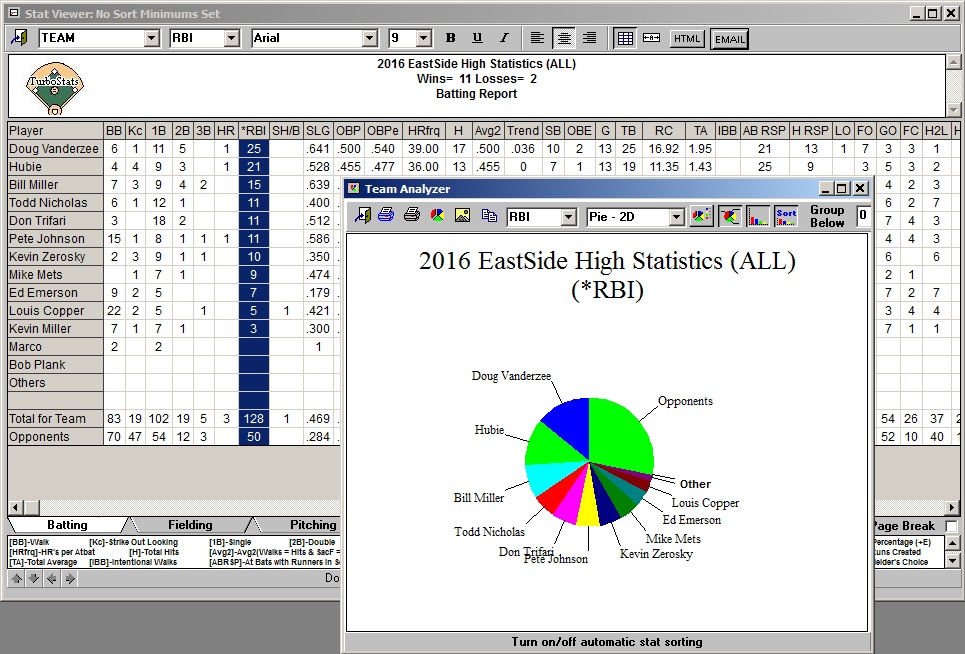
Graphics Viewer Show them where they stand,
graphically...Now you can
create bar, pie
or line graphs of any stat with just one click! Just highlight the stat column you want
to plot and press the plot icon. Graphs can be scaled to any size and can print on
any Windows printer. |